kubernetes HPA Horizontal Pod Autoscaler
AutoScaler:
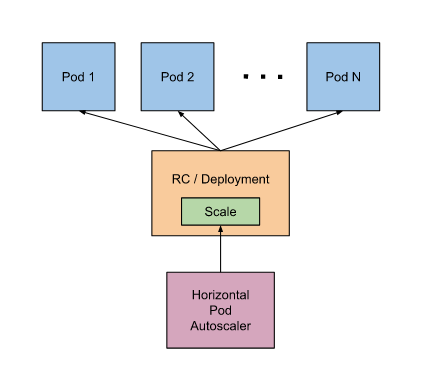
HPA:Horizontal Pod Autoscaler 水平扩缩容(读取更多指标需要kube-state-metrics组件支持)。
版本:v1,v2
CA:Cluster Autoscaler 集群扩缩容,增加或减少节点,需要借助虚拟化IaaS平台。
VPA:Vertical Pod Autoscaler 垂直扩缩容,增加单个Pod的资源能力。
AR:Addon Resizer 一个sidecar,Pod中定义的requests、limits,这个sidecar根据资源的实际使用情况来调整资源的上下限,在部署metrics-server中使用过这个镜像。
Pod水平自动伸缩 autoscaling/v2beta2 根据CPU或其他自定义资源指标来自动扩缩容 dm、rc、rs 资源。控制器周期性的获取资源指标来调整dm副本数量。 在controller-manager 的启动参数中 --horizontal-pod-autoscaler-sync-period 用来设置自动扩缩容的检查时间,默认15秒。
指标可以使用原始值,也可以使用百分比。自定义指标只能用原始值,自定义指标需要 metrics-server 服务。
在当前稳定版本(autoscaling/v1)中只支持基于CPU指标的缩放。在 beta 版本(autoscaling/v2beta2),引入了基于内存和自定义指标的缩放。 在autoscaling/v2beta2版本中新引入的字段在autoscaling/v1版本中基于 annotation 实现。
自动扩缩容的同时不支持升级版本。
metrics指标种类:要使用这些指标需要开启聚合层 API aggregation layer。
1、metrics.k8s.io API 由 metrics-server提供。
2、custom.metrics.k8s.io API 由 prometheus Adapter 提供。
3、external.metrics.k8s.io API 自定义指标。
v1、v2都要依赖核心资源指标功能,v2还依赖自定义资源指标功能。
手动扩缩容:
使用 kubectl scale 命令修改ReplicaSet 来扩容:
kubectl scale replicaset --replicas=2 nginx-dm-74754b979
使用 kubectl edit 来修改replicas 字段进行扩容:
kubectl edit deployments nginx-dm
修改资源文件的方式来扩容:
kubectl apply -f dm.yaml
自动扩缩容:
根据cpu的指标自动扩缩容:
kubectl autoscale deployment php-apache --cpu-percent=50 --min=1 --max=10
扩缩容官方文档:英文版内容更丰富一些。
https://kubernetes.io/docs/tasks/run-application/horizontal-pod-autoscale/
https://kubernetes.io/docs/tasks/run-application/horizontal-pod-autoscale-walkthrough/
压测命令:
~]# yum -y install httpd-tools
~]# ab -c 1000 -n 10000 10.97.34.63/demo
查看支持的版本:
kubectl api-versions
例:使用具体值
apiVersion: autoscaling/v2beta2
kind: HorizontalPodAutoscaler
metadata:
  name: hpa-name # 一般使用 deployment-name
spec:
  scaleTargetRef:
    apiVersion: apps/v1
    kind: Deployment
    name: deployment-name # 要自动伸缩的deployment控制器的名称
  minReplicas: 3
  maxReplicas: 5
  metrics:
  - type: Resource
    resource:
      name: cpu
      target:
        type: AverageValue
        averageValue: 90m
示例v2:
apiVersion: autoscaling/v2beta2
kind: HorizontalPodAutoscaler
metadata:
  name: php-apache
spec:
  scaleTargetRef:
    apiVersion: apps/v1
    kind: Deployment
    name: php-apache
  minReplicas: 1
  maxReplicas: 10
  metrics:
  - type: Resource # 还可以是Pods、Object
    resource:
      name: cpu # 可以是内存、磁盘空间利用率等
      target:
        type: Utilization # 类型为使用率,使用数值时的类型为 AverageValue
        averageUtilization: 50 # averageValue: 10m 使用数值
  - type: Resource
    resource:
      name: memory
      target:
        type: Utilization
        averageUtilization: 80 # averageValue: 100Mi 可以使用具体值
  - type: Pods
    pods:
      metric:
        name: packets-per-second
      target:
        type: AverageValue # 平均值
        averageValue: 1k # 平均值超过1k时进行缩放
  - type: Object # 类型为资源对象
    object:
      metric:
        name: requests-per-second
      describedObject:
        apiVersion: networking.k8s.io/v1beta1
        kind: Ingress
        name: main-route
      target:
        type: Value
        value: 10k
示例:
apiVersion: autoscaling/v2beta2
kind: HorizontalPodAutoscaler
metadata:
  name: php-apache
  namespace: default
spec:
  # HPA的伸缩对象描述,HPA会动态修改该对象的pod数量
  scaleTargetRef:
    apiVersion: apps/v1
    kind: Deployment
    name: php-apache
  # HPA的最小pod数量和最大pod数量
  minReplicas: 1
  maxReplicas: 10
  # 监控的指标数组,支持多种类型的指标共存
  metrics:
  # Object类型的指标
  - type: Object
    object:
      metric:
        # 指标名称
        name: requests-per-second
      # 监控指标的对象描述,指标数据来源于该对象
      describedObject:
        apiVersion: networking.k8s.io/v1beta1
        kind: Ingress
        name: main-route
      # Value类型的目标值,Object类型的指标只支持Value和AverageValue类型的目标值
      target:
        type: Value
        value: 10k
  # Resource类型的指标
  - type: Resource
    resource:
      name: cpu
      # Utilization类型的目标值,Resource类型的指标只支持Utilization和AverageValue类型的目标值
      target:
        type: Utilization
        averageUtilization: 50
  # Pods类型的指标
  - type: Pods
    pods:
      metric:
        name: packets-per-second
      # AverageValue类型的目标值,Pods指标类型下只支持AverageValue类型的目标值
      target:
        type: AverageValue
        averageValue: 1k
  # External类型的指标
  - type: External
    external:
      metric:
        name: queue_messages_ready
        # 该字段与第三方的指标标签相关联,(此处官方文档有问题,正确的写法如下)
        selector:
          matchLabels:
            env: "stage"
            app: "myapp"
      # External指标类型下只支持Value和AverageValue类型的目标值
      target:
        type: AverageValue
        averageValue: 30
HPA目前支持四种类型的指标,分别是Resource、Object、External、Pods。其中在稳定版本autoscaling/v1中只支持对CPU指标的动态伸缩,在测试版本autoscaling/v2beta2中支持memory和自定义指标的动态伸缩,并以annotation的方式工作在autoscaling/v1版本中。
autoscaling/v1版本将metrics字段放在了annotation中进行处理。
target共有3种类型:Utilization、Value、AverageValue。Utilization表示平均使用率;Value表示裸值;AverageValue表示平均值。
metrics:
metrics中的type字段有四种类型的值:Object、Pods、Resource、External。
Resource:
Resource指的是当前伸缩对象下的pod的cpu和memory指标,只支持Utilization和AverageValue类型的目标值。
Object:
Object指的是指定k8s内部对象的指标,数据需要第三方adapter提供,只支持Value和AverageValue类型的目标值。
Pods:
Pods指的是伸缩对象(statefulSet、replicaController、replicaSet)底下的Pods的指标,数据需要第三方的adapter提供,并且只允许AverageValue类型的目标值。
External:
External指的是k8s外部的指标,数据同样需要第三方的adapter提供,只支持Value和AverageValue类型的目标值。
类型为Pods:使用Pods中的某一个metrics来控制,Pods内部一些应用输出的资源指标来控制缩放
type: Pods
pods:
  metric:
    name: packets-per-second # pods内部的metrics名字 http://10.97.34.63/metrics
  target:
    type: AverageValue # 使用平均值进行评估
    averageValue: 1k
使用实例:
apiVersion: autoscaling/v2beta2
kind: HorizontalPodAutoscaler
metadata:
  name: service-api
spec:
  scaleTargetRef:
    apiVersion: apps/v1
    kind: Deployment
    name: service-api
  minReplicas: 2
  maxReplicas: 5
  metrics:
  - type: Resource
    resource:
      name: cpu
      target:
        type: AverageValue
        averageValue: 90m
根据Pod中输出的指标HPA示例:
apiVersion: autoscaling/v2beta1 # 这里使用的是beta1版本
kind: HorizontalPodAutoscaler
metadata:
  name: metrics-app-hpa
spec:
  scaleTargetRef:
    apiVersion: apps/v1
    kind: Deployment
    name: metrics-app
  minReplicas: 2
  maxReplicas: 10
  metrics:
  - type: Pods
    pods:
      metricName: http_requests # 这个指标是 http://PodIP/metrics 中的指标名称
      targetAverageValue: 800m # 取平均值
---
apiVersion: apps/v1
kind: Deployment
metadata:
  labels:
    app: metrics-app
  name: metrics-app
spec:
  replicas: 2
  selector:
    matchLabels:
      app: metrics-app
  template:
    metadata:
      labels:
        app: metrics-app
      annotations:
        prometheus.io/scrape: "true" # 允许Prometheus抓取数据
        prometheus.io/port: "80" # 抓取端口
        prometheus.io/path: "/metrics" # 抓取路径
    spec:
      containers:
      - image: ikubernetes/metrics-app
        name: metrics-app
        ports:
        - name: web
          containerPort: 80
        resources:
          requests:
            cpu: 200m
            memory: 256Mi
        readinessProbe:
          httpGet:
            path: /
            port: 80
          initialDelaySeconds: 3
          periodSeconds: 5
        livenessProbe:
          httpGet:
            path: /
            port: 80
          initialDelaySeconds: 3
          periodSeconds: 5
---
apiVersion: v1
kind: Service
metadata:
  name: metrics-app
  labels:
    app: metrics-app
spec:
  ports:
  - name: web
    port: 80
    targetPort: 80
  selector:
    app: metrics-app
  type: ClusterIP
adapter的安装:自定义资源指标组件将prometheus的指标转换成k8s可用的指标。
https://scriptjc.com/article/934
prometheus adapter 官方配置文档:
https://github.com/kubernetes-sigs/prometheus-adapter/blob/master/docs/config.md
配置示例:
https://github.com/kubernetes-sigs/prometheus-adapter/blob/master/deploy/manifests/custom-metrics-config-map.yaml
配置实例:
编辑配置:
kubectl edit configmaps -n kube-system prometheus-adapter
加入的配置如下:配置完成后需要重启pod使配置生效
    - seriesQuery: 'trust_gateway_http_requests_total'
      seriesFilters: []
      resources:
        template: <<.Resource>>
      name:
        matches: "^(.*)_total"
        as: "${1}_per_second"
      metricsQuery: sum(rate(<<.Series>>{<<.LabelMatchers>>}[5m])) by (<<.GroupBy>>)
查看指标:
]# kubectl get --raw /apis/custom.metrics.k8s.io/v1beta1 | jq | grep trust
      "name": "jobs.batch/trust_gateway",
External:
官方文档:
https://github.com/kubernetes-sigs/prometheus-adapter/blob/master/docs/externalmetrics.md
external.metrics.k8s.io:注册api
apiVersion: apiregistration.k8s.io/v1
kind: APIService
metadata:
  annotations:
  labels:
    app: prometheus-adapter # 用来关联安装的adapter
    release: prometheus-adapter
spec:
  group: external.metrics.k8s.io
  groupPriorityMinimum: 100
  insecureSkipTLSVerify: true
  service: # 指定service的相关信息
    name: prometheus-adapter
    namespace: kube-system
    port: 443
  version: v1beta1
  versionPriority: 100
调用上面注册的api来获取外部指标:
kubectl get --raw "/apis/external.metrics.k8s.io/v1beta1" | jq
获取指标:items要有数据才行,这里没获取到数据。
kubectl get --raw "/apis/external.metrics.k8s.io/v1beta1/namespaces/kube-system/trust_gateway_http_requests_per_second" | jq{
  "kind": "ExternalMetricValueList",
  "apiVersion": "external.metrics.k8s.io/v1beta1",
  "metadata": {},
  "items": []
}
其他参考:
zhuanlan.zhihu.com/p/89453704
qikqiak.com/post/k8s-hpa-usage
cnblogs.com/charlieroro/p/11898521.html
github.com/kubernetes-sigs/prometheus-adapter
artifacthub.io/packages/helm/prometheus-community/prometheus-adapter